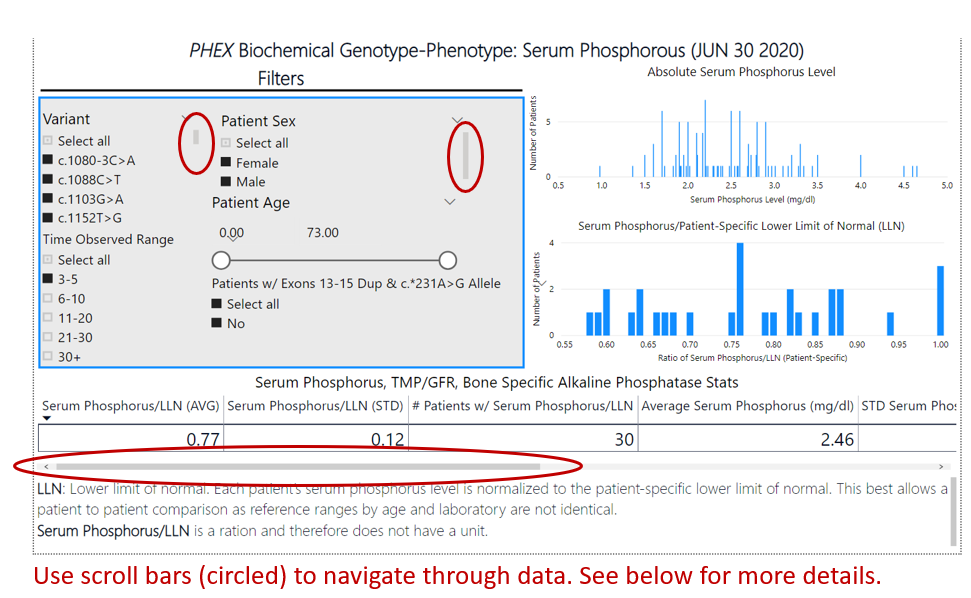
How to Use PowerBI Pages
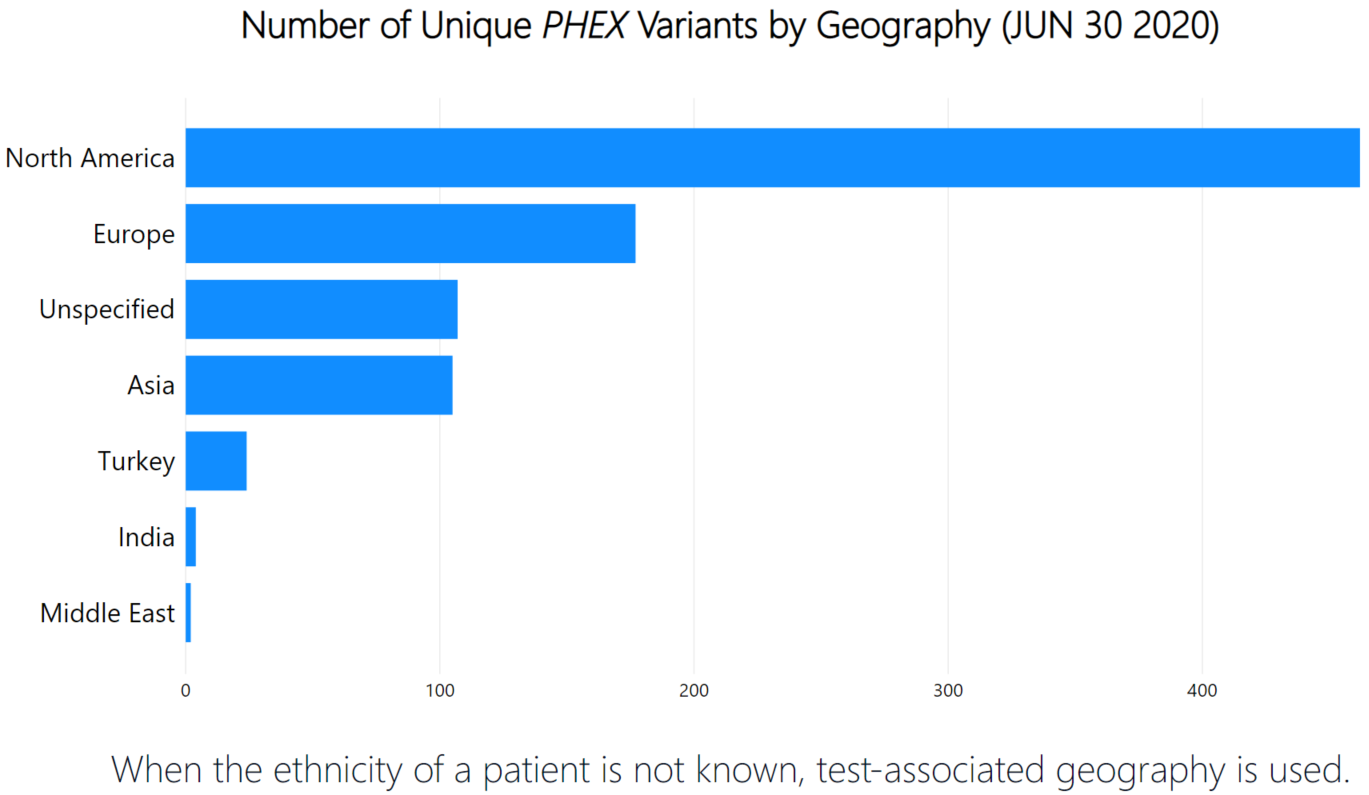
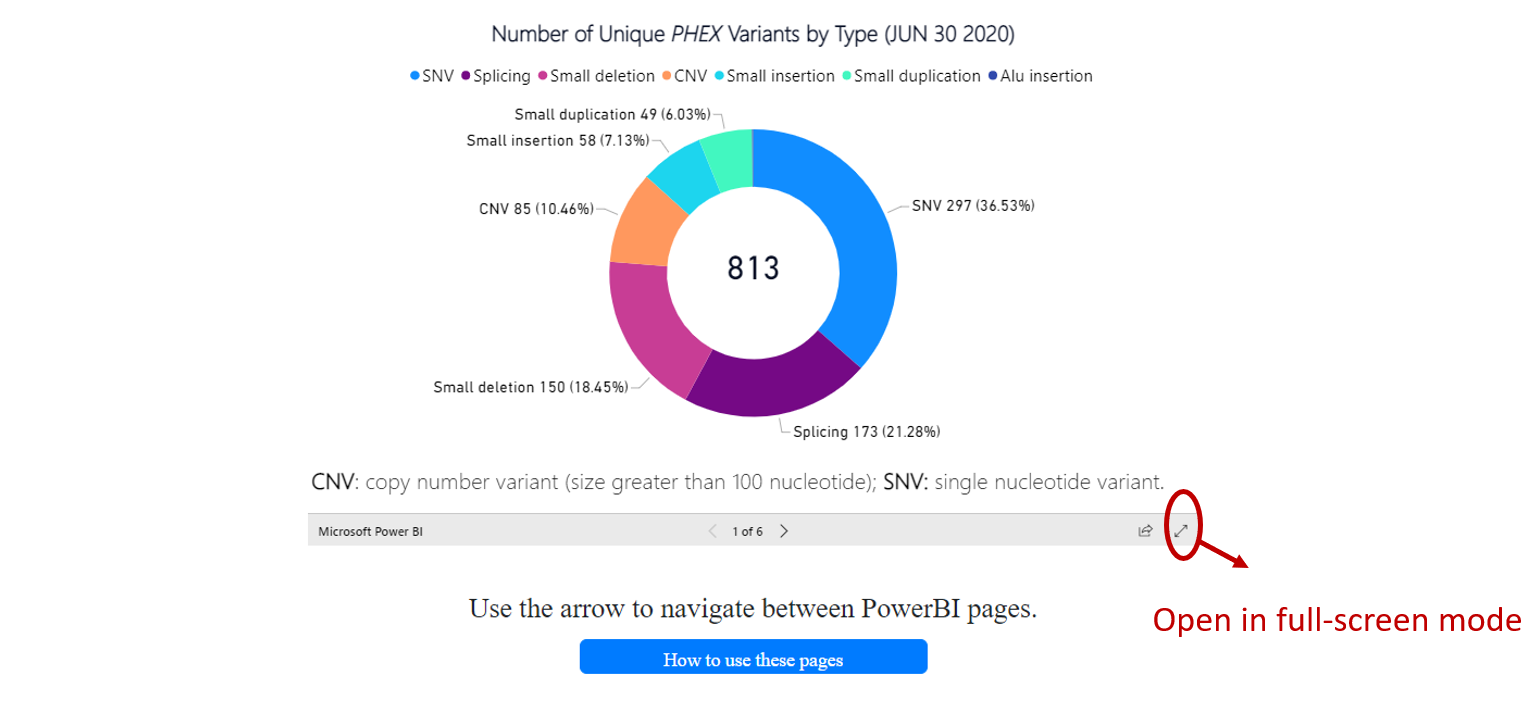
Number of unique PHEX variants
Number of unique PHEX variants by type are shown according to the data cut (date noted). Clicking on each type will give you the number for that type and will grey out the others. For a better resolution, we recommend you open PowerBI pages in full-screen mode as shown below.
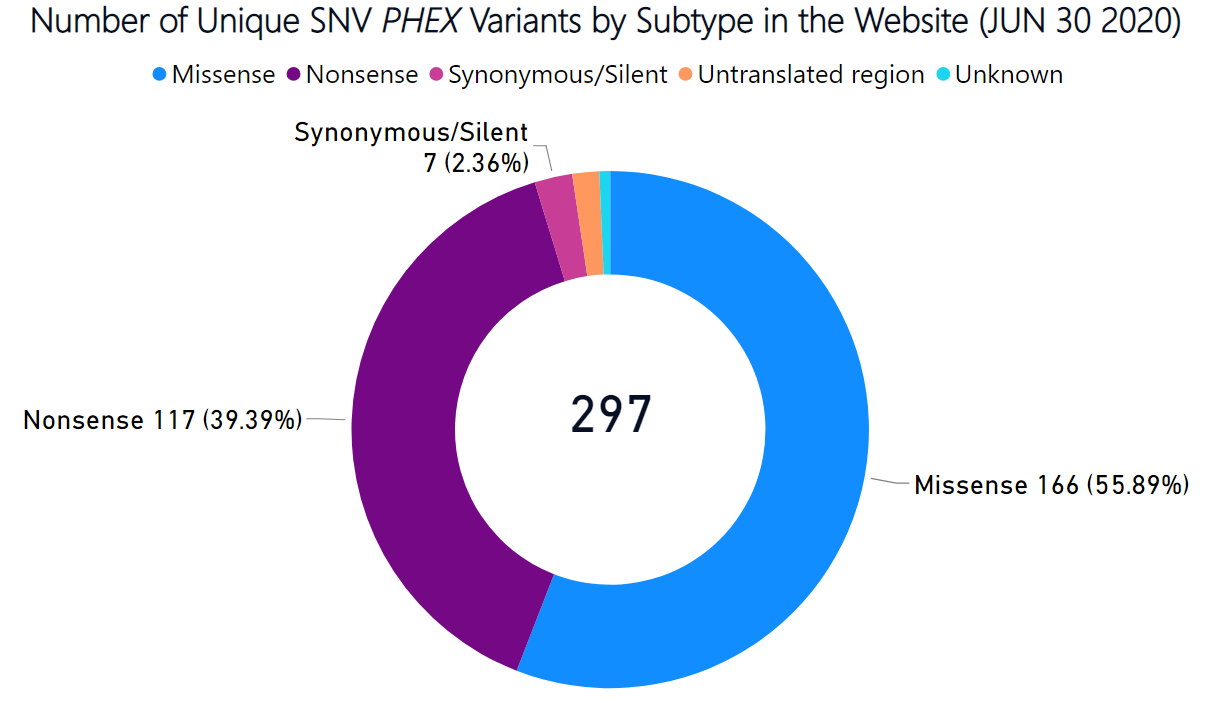
Number of unique SNV variants
Number of unique SNV variants by effect according to the data cut (date noted). Clicking on each type will give you the number for that type and will grey out the others.
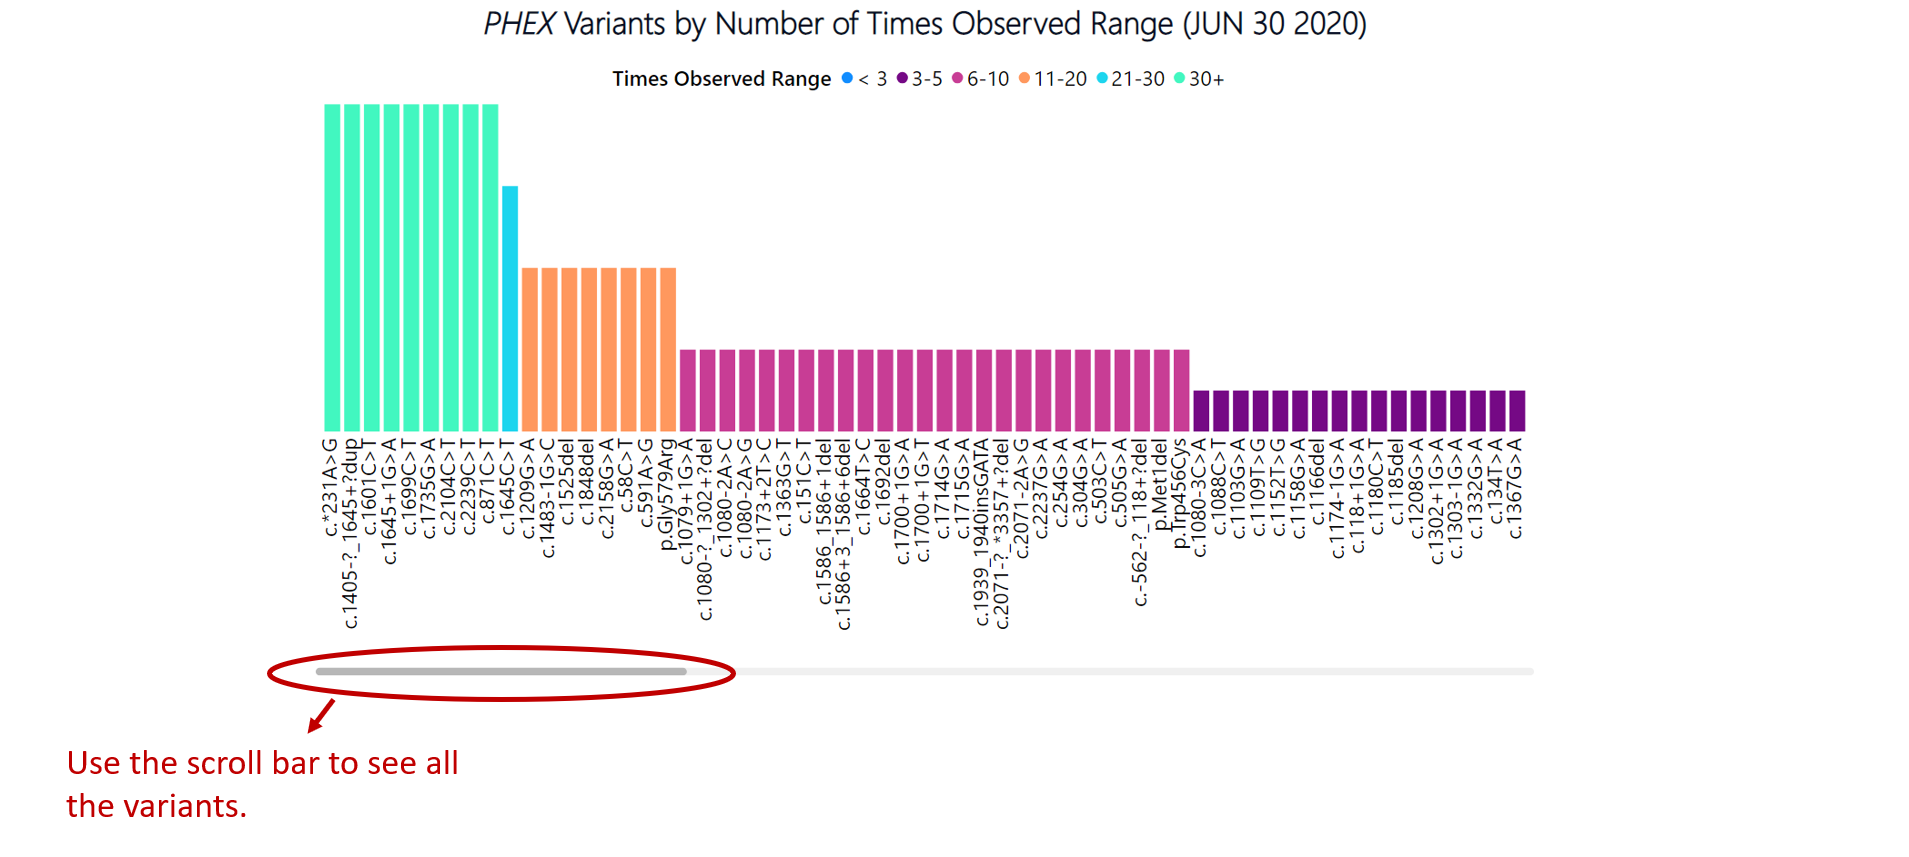
PHEX variants by the number of times observed
PHEX variants by the number of times observed. Variants are color-coded by the number of times observed
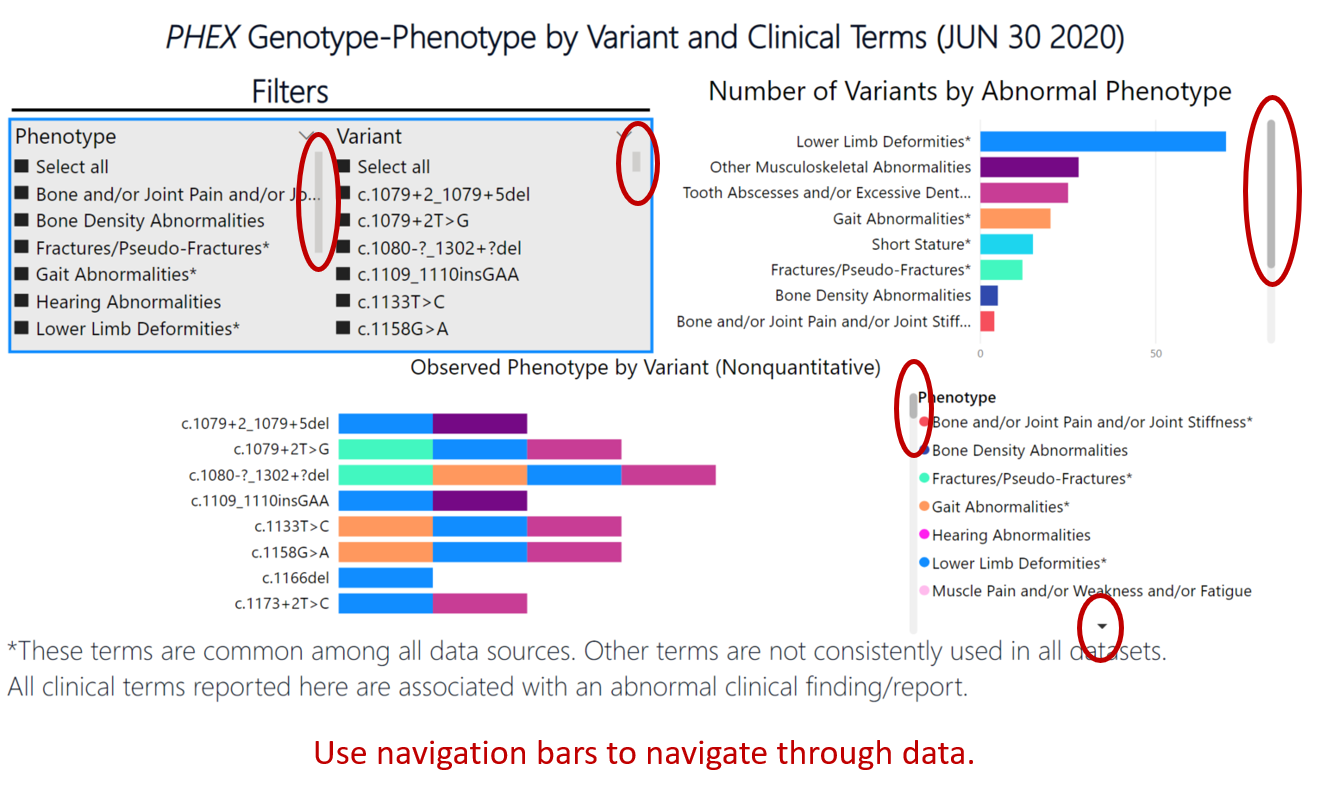
PHEX Biochemical Genotype-Phenotype
Table
Definition of terms used on this page: the example shown is for a snapshot of all the data. For this example, filters are set at select all. A change in the filters will change the values shown.
| Value | Value Definition | Value without Using Any Filter |
|---|---|---|
| Serum Phosphorus / LLN (AVG) | Average of serum phosphorus divided by the lower limit of normal (LLN) range. LLN used is the patient-specific value provided. | 0.75 |
| Serum Phosphorus / LLN (STD) | Serum phosphorus divided by the lower limit of normal (LLN) standard deviation. | 0.15 |
| # Patient w/ Serum Phosphorus / LLN | Number of patients who have serum phosphorus / LLN. These patients have both serum phosphorus levels and normal ranges of these values. | 148 |
| Average Serum Phosphorus (mg/dl) | Average of serum phosphorus level, unit = mg/dl | 2.32 |
| STD Serum Phosphorus (mg/dl) | Standard deviation of serum phosphorus | 0.57 |
| # Patients w/ Serum Phosphorus | Number of patients who have a value reported for serum phosphorus level | 746 |
| Average TmP/GFR (mg/dl) | Average of Tmp/GFR, unit = mg/dl | 2.27 |
| STD TmP/GFR (mg/dl) | Standard deviation of TmP/GFR | 2.13 |
| # Patients w/ TmP/GFR | Number of patients with TmP/GFR value | 97 |
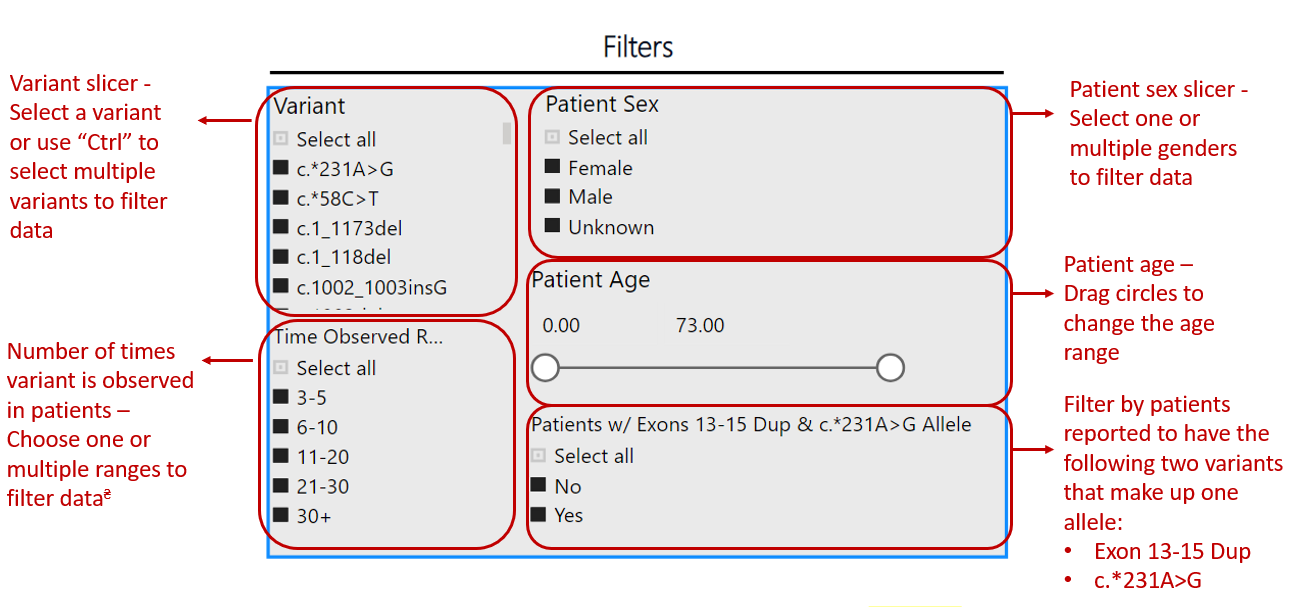
Filter
Users may filter data by: Variant / Patient Sex / Number of Times [Variant] Observed / Patient with Exons 13-15 Duplication and c.*231A>G Allele
/ Patient Age
Graphs
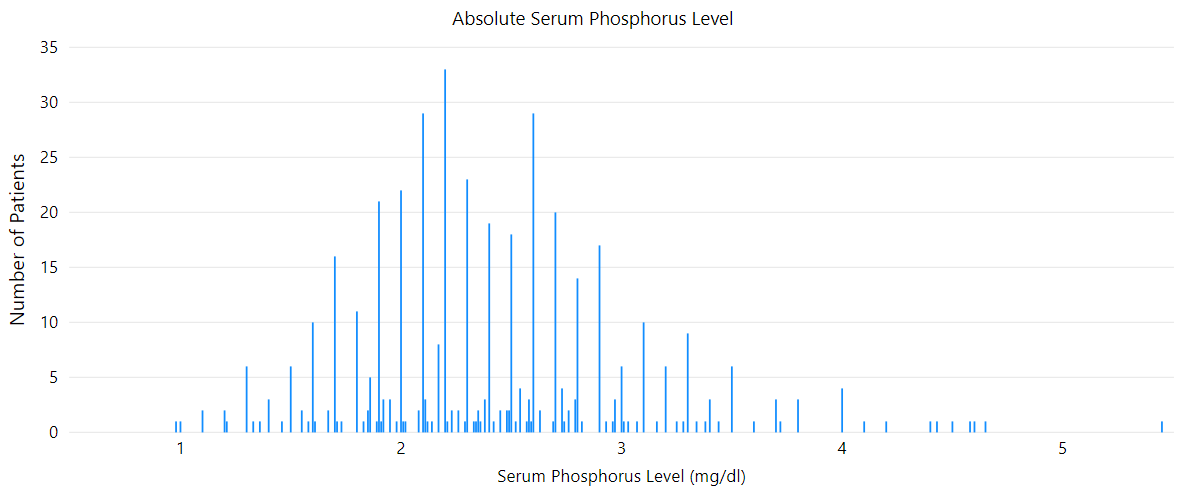
The graph below shows serum phosphorus levels for a total of 746 patients. Any filtering will affect this graph.
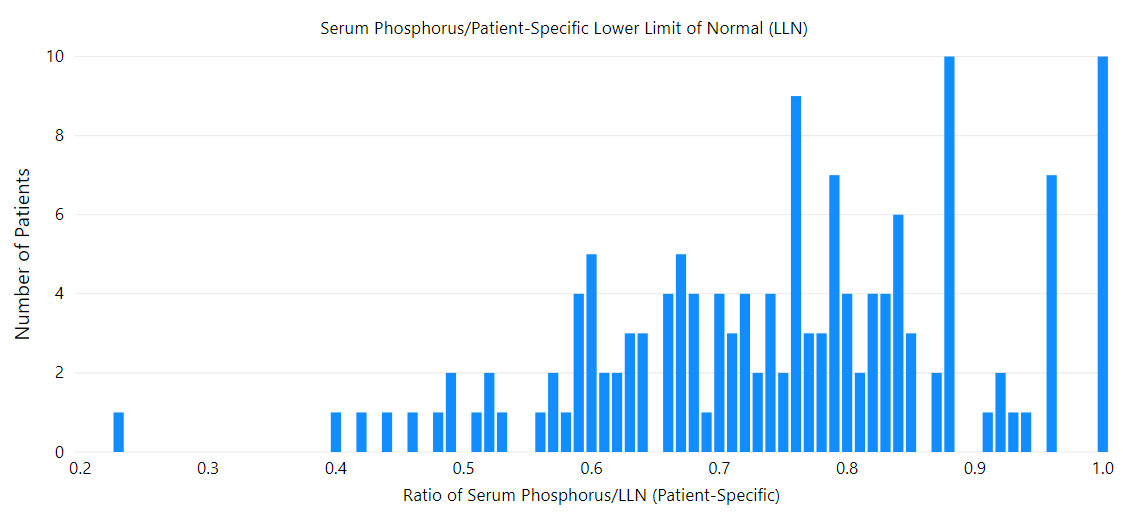
A patient’s serum phosphorus level is normalized to the patient-specific lower limit of normal (LLN). This best allows a patient-to-patient comparison as reference ranges by age and laboratory are not identical. Serum Phosphorus/LLN is a ratio and therefore does not have a unit. Any filtering will affect this graph.
PHEX Genotype-Phenotype By Variant
Number of Unique PHEX Variants
Serum Phosphorus/Patient-Specific